ValiProof documentation
Copyright © 2009 Martin Weberg
Revision: 2009-10-21 11:14 covering v.0.2.0
This manual is a work in progress.
Table of contents
About
ValiProof is a open source comparison and validation tool for proofing processes in the graphic arts industry. Use ValiProof to ensure that your proofing system are colorimetrically performing according to standards. Generate validation reports for documentation use within quality management systems.
ValiProof is written in Python using NumPy (arrays and calculations) and wxPython (GUI). Stand-alone executables are built using py2exe (Windows) and py2app (Mac OS X).
License
ValiProof is free software: you can redistribute it and/or modify it under the terms of the GNU General Public License as published by the Free Software Foundation, either version 3 of the License, or (at your option) any later version.
ValiProof is distributed in the hope that it will be useful, but WITHOUT ANY WARRANTY; without even the implied warranty of MERCHANTABILITY or FITNESS FOR A PARTICULAR PURPOSE. See the GNU General Public License for more details.
You should have received a copy of the GNU General Public License along with ValiProof. If not, see http://www.gnu.org/licenses/.
Features
- Colorimetric validation of hard copy proof
- Validation report for quality management system
- Supports ISO 12642-2 (IT8.7/4) chart
- Descriptive statistics of colour difference
- Colour difference table for analysis
Installation
Before installation, remove previous installations of ValiProof.
ValiProof are provided as source code for all platforms and as stand-alone executables for Windows (.exe) and Mac OS X (.app). Linux users need to get prerequisites up and running before launching ValiProof from source. See details below.
Stand-alone executable (Windows, Mac OS X)
Stand-alone executables of ValiProof are currently only available for Windows (.exe) and Mac OS X (.app). Running ValiProof from stand-alone executables requires no installation. Download and unpack preferably to the applications folder. Run ValiProof from the unpacked folder or create a desktop shortcut.
Source code (All platforms)
Running ValiProof from source code requires Python 2.6. Furthermore, you need to install NumPy 1.3 and wxPython 2.8.
Simply run ValiProof.py if python script files (.py) are associated with Python. Or run ValiProof using shell command: python ValiProof.py
Uninstall
ValiProof does not have a dedicated uninstall. Delete the ValiProof folder and all it's components. Also delete the config file '.ValiProof.cfg' from your home folder.
User interface
File menu
Save validation report [Ctrl+S]
'Save validation report...' generates a text file for documentation in quality management systems. 'Save validation report...' is available only after a successful validation.
Quit [Ctrl+Q]
Quits ValiProof. If a comparison/validation has been performed but no report has been saved a quit confirmation dialog appear. Last used reference data file are stored for next session.
Help menu
Check for update
'Check for update' connects to ValiProof web site and check for a new version.
Online documentation
'Online documentation' opens ValiProof documentation web page in the system standard browser.
Online help forum
'Online help forum' opens ValiProof online help forum web page in the system standard browser.
Report bug
'Report bug' opens ValiProof bug tracker web page in the system standard browser.
Donate
'Donate' opens ValiProof project donation web page in the system standard browser.
About
'About' display general information and license.
Proofing data
Click 'Open...' to open proofing data. Data need to be retrieved from a ISO 12642-2 (also known as IT8.7/4) chart. Data also need to be formatted as CGATS and saved as any of .txt, .cgats and .ti3.
Required keywords in CGATS (case sensitive): BEGIN_DATA_FORMAT, SAMPLE_ID, CMYK_C, CMYK_M, CMYK_Y, CMYK_K, LAB_L, LAB_A, LAB_B, BEGIN_DATA, END_DATA.
Reference data
Click 'Open...' to open reference data. Data need to be retrieved from a ISO 12642-2 (also known as IT8.7/4) chart. Data also need to be formatted as CGATS and saved as any of .txt, .cgats and .ti3.
Required keywords in CGATS (case sensitive): BEGIN_DATA_FORMAT, SAMPLE_ID, CMYK_C, CMYK_M, CMYK_Y, CMYK_K, LAB_L, LAB_A, LAB_B, BEGIN_DATA, END_DATA.
Compare data
Compare
The 'Compare' button executes comparison and validation. 'Compare' is available only after that proofing and reference data have been successfully opened.
Table
The 'Table...' button opens a colour difference table. Use this to analyze colour differences in detail. 'Table...' is available only after that comparison/validation has been successfully performed.
Descriptive statistics
Not finished
Descriptive statistics gives an overall sense of the colour differences between the proofing and reference data.
Colour differences are presented in CIE delta E* 1976 and 2000 (dE76 and dE00). dE76 is the most common and used by ISO. dE00 is more perceptually uniform thus correspond better to human vision than dE76.
Sample
The size of sample in the dE* data set. The more samples the higher precision of estimations. Currently, ValiProof only supports the ISO 12642-2 chart using 1617 patches. Sample size at Wikipedia
Mean
The arithmetic mean of the dE* data set. A measure of central tendency. However, greatly influenced by outliers and skewed distributions. Colour difference data are often skewed, the median is a better estimation at those occasions. Arithmetic mean at Wikipedia
Median
The median of the dE* data set. A robust measure of central tendency. Not sensitive to outliers and skewed distributions. Median at Wikipedia
Standard deviation
The standard deviation of the dE* data set. A measure of variability of colour differences. A low standard deviation indicate that colour differences have a low variation around the mean. A high standard deviation indicate that colour differences have a high variation around the mean. Standard deviation at Wikipedia
Median absolute deviation (MAD)
The median absolute deviation (MAD) of the dE* data set. A robust measure of variability of colour differences. MAD is a better estimation of variability when the dE* data set has outliers and/or is skewed. Median absolute deviation at Wikipedia
Minimum
The smallest colour difference measured between proofing and reference data.
Maximum
The largest colour difference measured between proofing and reference data.
90th percentile
The 90th percentile of the colour difference data. 90 percent of the color differences are below the 90th percentile value. Percentile at Wikipedia
Skewness
Skewness is a measure of the dE* data set distribution.
- Positive skewness ~ many relatively low dE* values
- Negative skewness ~ many relatively high dE* values
- Zero skewness ~ equal amount low/high dE* values
Kurtosis
Kurtosis is a measure of the dE* data set distribution.
- Positive kurtosis ~ peaked distribution
- Negative kurtosis ~ flat distribution
- Zero kurtosis ~ normal distribution
ISO 12647-7 contract proof validation
ISO 12647-7 specifies requirements for systems that are used to produce hard-copy digital proof prints intended to simulate a printing condition defined by a set of characterization data. Most of the colorimetric evaluations in ISO 12647-7 are performed by ValiProof, i.e. coloration of printed parts, tone value and gamut. Remember, this is a colorimetric validation only. A complete certification of the proofing system to ISO 12647-7 involves several additional criteria.
Each criteria is followed by a tolerance which must not be exceeded. All criterions must pass for a successful validation.
All patches, average
Arithmetic mean dE*76 of the ISO 12642-2 chart.
All patches, 95th percentile
95th percentile dE*76 of the ISO 12642-2 chart.
Outer gamut, average
Arithmetic mean dE*76 of 226 outer gamut patches of the 12642-2 chart.
Paper simulation
dE*76 of paper simulation.
Fogra media wedge v3, max
Maximum dE*76 of Fogra media wedge v3 subset of the ISO 12642-2 chart.
Fogra media wedge v3, average
Arithmetic mean dE*76 of Fogra media wedge v3 subset of the ISO 12642-2 chart.
CMYK solids, max
Maximum dE*76 of 100% solids of C, M, Y, and K.
CMYK solids, max dH*
Maximum dH* of 100% solids of C, M, Y, and K.
CMY grey, average dH*
Arithmetic mean dH* of CMY grey patches found on Fogra media wedge v3 subset of the ISO 12642-2 chart.
Tone value difference, max
Maximum colorimetric tone value difference of primary colours found on Fogra media wedge v3 subset of the ISO 12642-2 chart. Tone values tested are 0, 10, 20, 40, 70 and 100 percent.
IDEAlliance hard copy proof validation
IDEAlliance (International Digital Enterprise Alliance) is an organization providing a proofing certification and verification program. Most of the colorimetric evaluations in "IDEAlliance Hard Copy Proofing System Certification Process" are performed by ValiProof.
Each criteria is followed by a tolerance which must not be exceeded. All criterions must pass for a successful validation.
All patches, average
Arithmetic mean dE*76 of the ISO 12642-2 chart.
All patches, 95th percentile
95th percentile dE*76 of the ISO 12642-2 chart.
Solid patches cyan, magenta, yellow, red, green and blue
Maximum dE*76 of solid patches, primaries and secondaries. Note that black (K) colour is not included.
50/40/40 grey
dE*76 of the grey C:50, M:40, Y:40, K:0 patch.
Paper white
dL*, da* and db* of paper white. Note that IDEAlliance define these numbers without florescence. However, they provide no definition of florescence or algorithm to exclude it from spectral data.
Colour difference table
The colour difference table displays following data: ID, CMYK values, reference L*a*b* values, dL*, da*, db*, dC*, dH*, dE*76 and dE*00. Reference and proofing colours are shown in sRGB colour space. dE* data are coloured orange if above 1.5 and red above 4. Sort columns by right-clicking labels.
Tutorials
Working example
This tutorial will go through the process of performing a colorimetric validation of a hard copy proofing process. The user is assumed to know the basics of proofing. Set-up and configuration of a proofing process is not covered by this tutorial.
First, we need two set of data, proofing and reference data that are to be compared. Both proofing and reference data need to be obtained from the ISO 12642-2 data set (also known as IT8.7/4). Data need to be formatted as CGATS and saved as any of .txt, .cgats and .ti3.
Proofing data
Proofing data is obtained by sending the ISO 12642-2 chart through the targeted proofing process. The chart need to take the exact same path as a hard copy proof normally would. Then, after drying (stabilizing), the proof need to be measured using a spectrophotometer. Choose measurement tool and software by personal preference and save the data formatted as CGATS. Download example file here.
Tutorial: Acquire proofing data using ColorPort or ArgyllCMS.
Reference data
Reference data for standard printing processes are usually provided by various organizations. The International Color Consortium (ICC) web site is a good place to find up-to-date references. Make sure it is ISO 12642-2 data set consisting of 1617 patches and formatted as CGATS.
For this example the proofing process is set-up to simulate sheet-fed offset according to ISO 12647-2 paper type 1 and 2. Then, FOGRA39L is a suitable reference, being the most recent data set available from Fogra. Download FOGRA39L.txt here.
Comparing data
When you have the proofing and reference data at hand, proceed by opening the data files. Then click "Compare".

The data are now compared, colour differences calculated and validation performed. First thing to look at is the descriptive statistics data.
Descriptive statistics
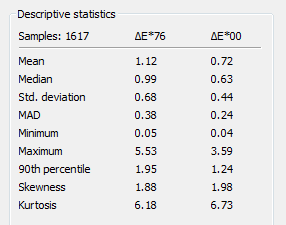
The descriptive statistics section give us important information about the distribution of the colour difference data. Following is the descriptive statistics output comparing Process_control_081201.txt and FOGRA39L.txt.

So, what does all this tell us? 1617 samples were compared and presented statistics are based on those comparisons. (Currently, ValiProof only supports the ISO 12642-2 chart which always contain 1617 patches.)
Mean and standard deviation are good estimators of central tendency if the data set is normally distributed. A normal distribution have a skewness around zero. Skewness at 1.88/1.98 indicate that we got a right-skewed distribution meaning that it is not normally distributed and that we got relatively many low delta E values and relatively few high delta E values. In this case, the median and median absolute deviation (MAD) are better estimators of central tendency. This situation is typical for a proofing process where the reference gamut in some regions exceeds the proofer gamut.
Maximum values of 5.53/3.59 could be a problem depending on what colours/regions affected. Let's take a look in the table.
Colour difference table
By clicking "Table..." colour differences are presented in a table. Colour differences are split into various components which could be used to analyze problematic areas with high delta E. To do this effectively, sort columns by right-clicking the labels. Values larger then 1.5 delta E are coloured orange and values larger then 4 delta E are coloured red. Colours displayed are in the sRGB colour space. Let's explore those high delta E's in our example.

Sorting the table by delta E*00 reveal that some dark colours are not properly simulated. It is mainly colours containing 100 percent yellow and black. Looking at the delta L column we see that those dark colours are too light and that this is the major component of the total colour difference. There are also lost chroma (negative delta C) and hue difference (delta H) in some dark red samples.
Validation
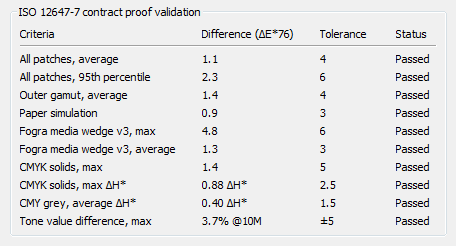
Now, let's take a look at the validation results starting with the ISO 12647-7 contract proof validation.

Well, everything passed. Any close calls? Not really. All colour differences are below half the tolerance except the maximum colour and tone value difference of the Fogra media wedge v3 sub-set.
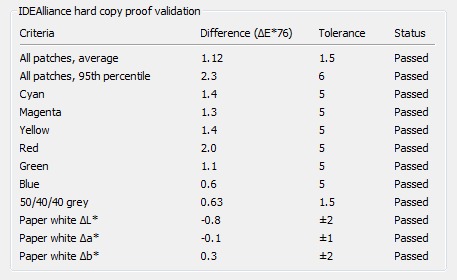
What about the IDEAlliance hard copy proof validation?

Again, everything passed. All colour differences are below half the tolerance except the all patches average at 1.12 delta E*76.
To summarize, the tested proofing system in this example are within the colorimetric requirements of both ISO 12647-7 and IDEAlliance hard copy proof validation (note that there are other criterions not tested by ValiProof). However, we have also identified some regions where simulation is not that great. Maybe, the printer ink limiting and/or linearization could be tweaked before making the next profile?
Validation report
Now, passed or failed, a validation report should be saved. Click "File/Save validation report..." or hit "Ctrl+S" to save a text file. Print it or store it for follow-ups.
Acquire proofing data using ColorPort
ColorPort is a free tool that let you create charts and measure data if you have a spectrophotometer from X-Rite and use Windows or Mac. Download ColorPort.
Create chart (ISO 12642-2)
- Click on the 'Create Target' tab
- Select model of your spectrophotometer 'Measurement Device'
- Select CMYK at 'Color Space'
- Select 'IT8.7 4 Random' at 'Patch Set'
- Select 'Paper Size' of your choice. 'Margins' are often best set at 0.
- Click 'Save Target...'
Now you have one or many TIF-files that you can send through your proofing process as you would with any file. Do that and proceed to measuring.
Measure chart and save CGATS
- Click on the 'Measure Target' tab
- Select your previously created target at 'Target'
- Select model of your spectrophotometer 'Measurement Device'
- Click 'Connect' and follow ColorPort's instructions
- Click 'Save Data...' and choose CGATS formatted file.
That's it! Now use ValiProof and compare/validate your newly measured proofing process.
Acquire proofing data using ArgyllCMS
ArgyllCMS is an open source colour management system supporting a range of popular spectrophotometers. Download ArgyllCMS (installation and general usage of ArgyllCMS are not covered in this tutorial).
Create chart (ISO 12642-2)
First we need a Argyll Target Information 1 file (.ti1) containing the ISO 12642-2 device values. Download here. Next we'll create a TIF chart size A4 for an EyeOne Pro:
printtarg -v -ii1 -n -t -L -pA4 ISO_12642-2_chart
Check printtarg documentation for more/other settings. Now you have one or many TIF-files that you can send through your proofing process as you would with any file. Do that and proceed to measuring.
Measure chart and save TI3 (CGATS)
Measure your printed chart using:
chartread -v -n -l -H ISO_12642-2_chart
The measurement file will be saved as .ti3 automatically. Check chartread documentation for more/other settings.
That's it! Now use ValiProof and compare/validate your newly measured proofing process.